Chris Blum, home

Biomarker Dashboard

A blood-work product for a preventative medicine practice — built on the gap between what a lab calls normal and what a clinician would call optimal, and on turning that gap into something a patient can actually act on.

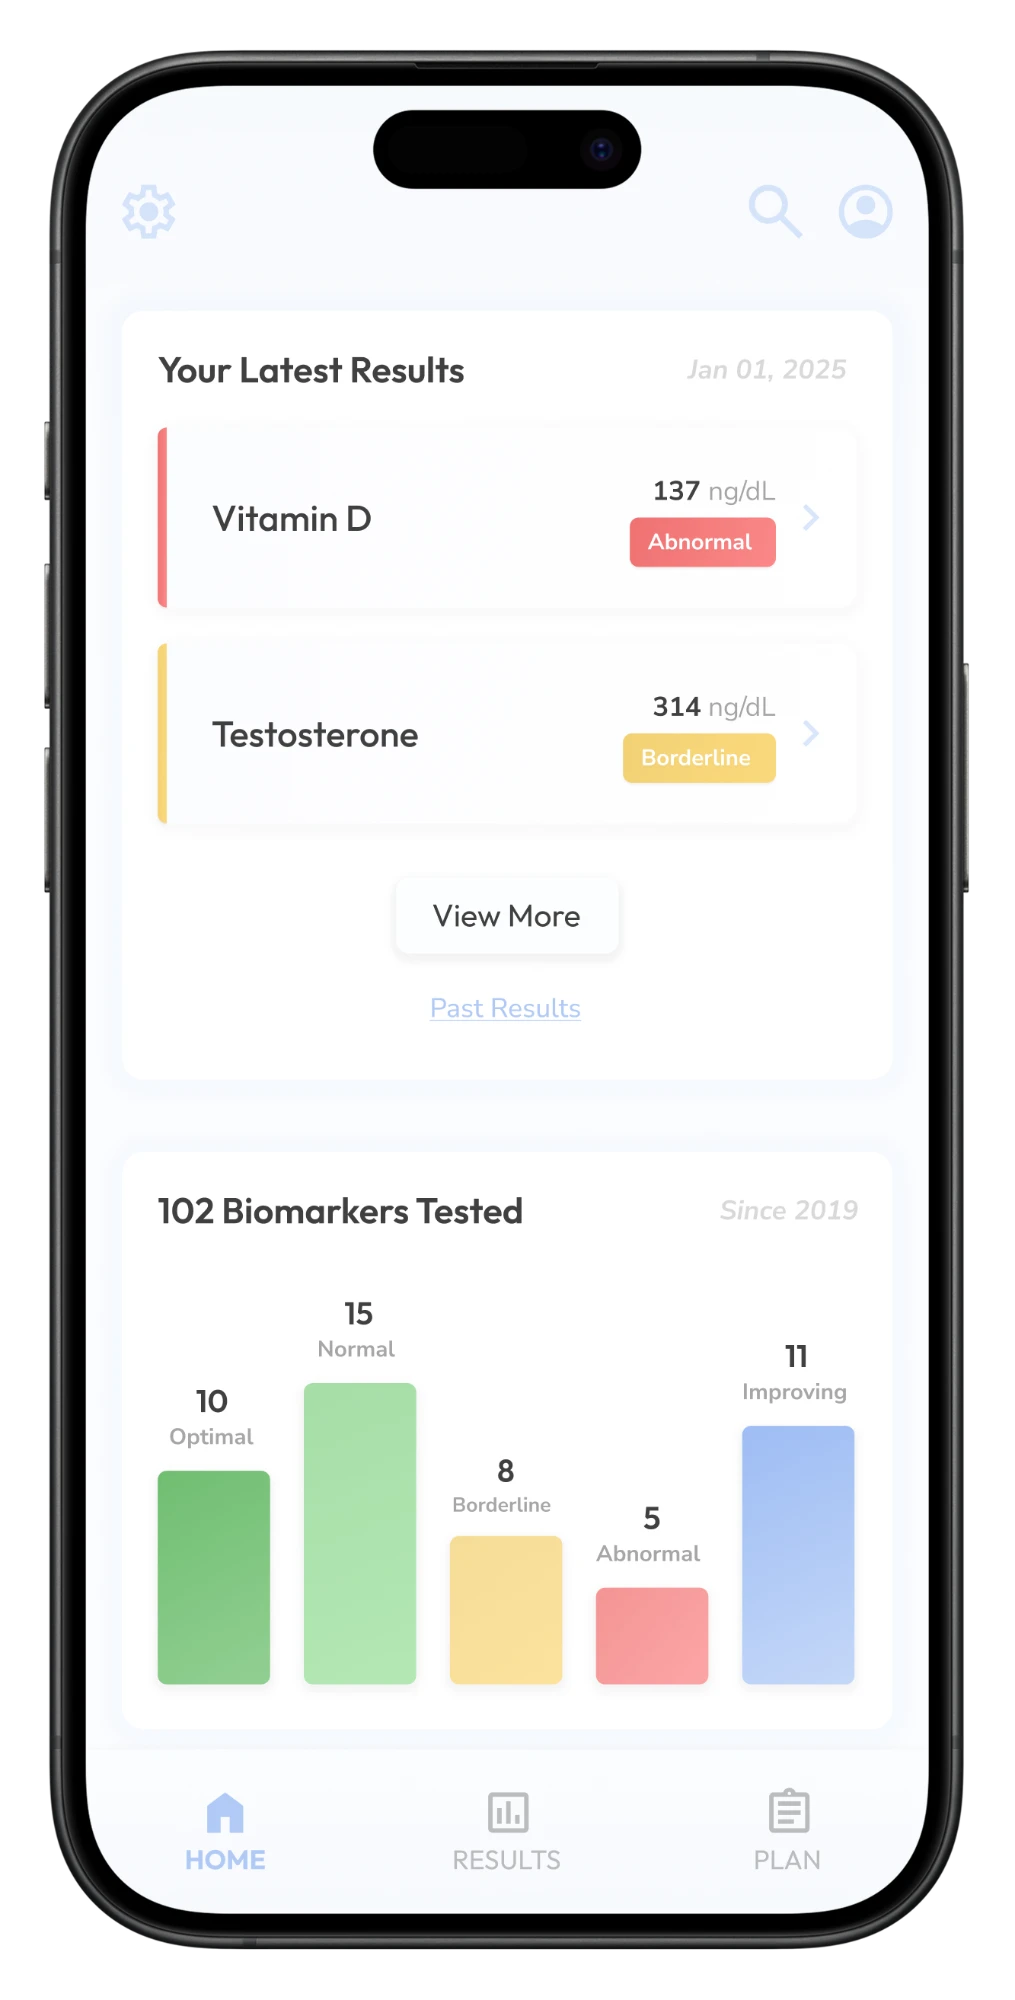
Home screen: latest results and a breakdown of biomarkers by category
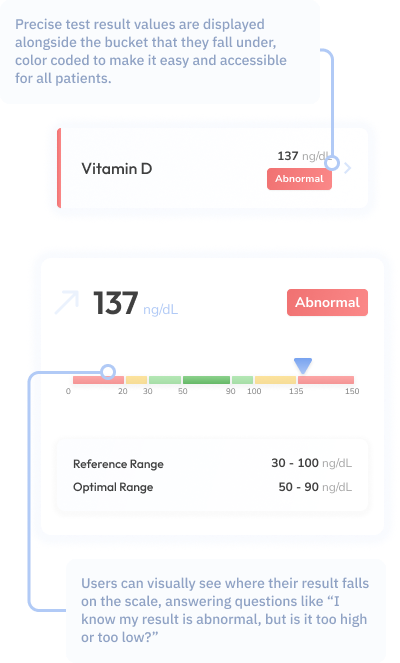
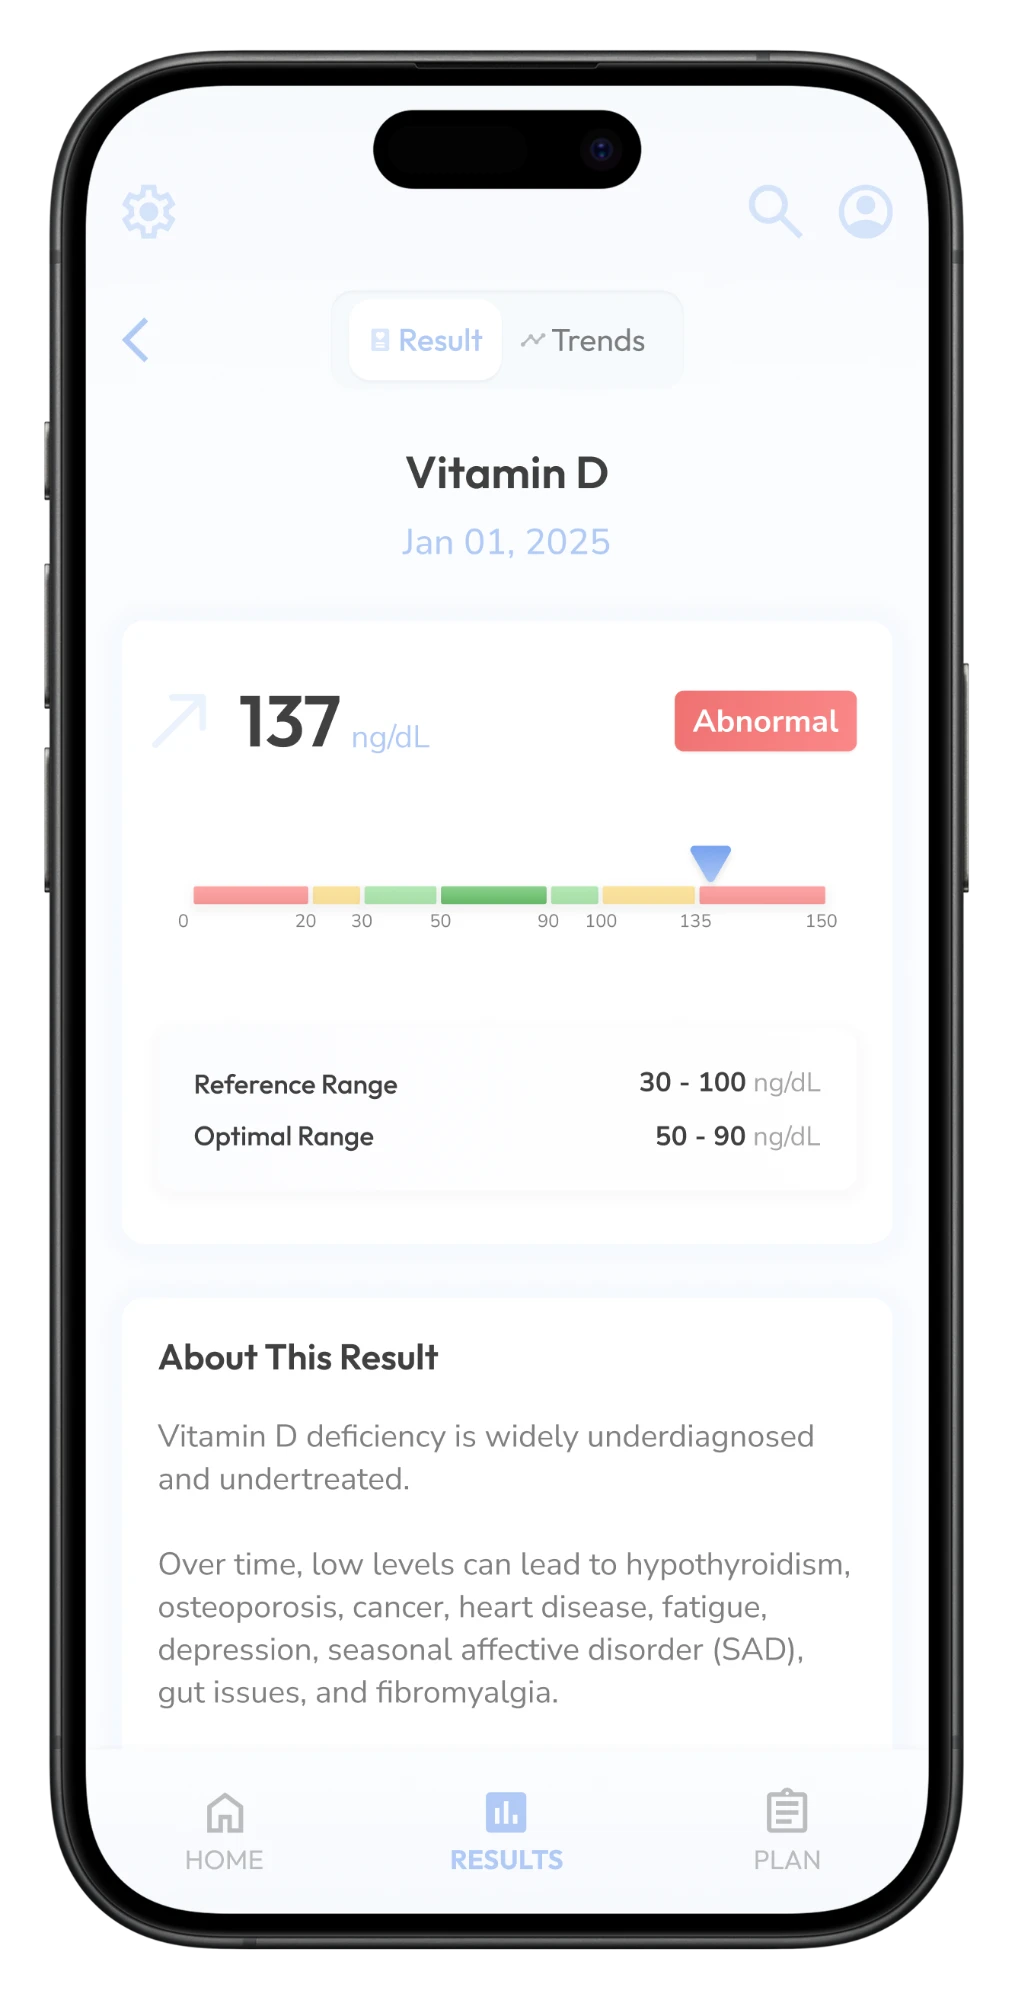
Vitamin D result: the value against its reference and optimal ranges
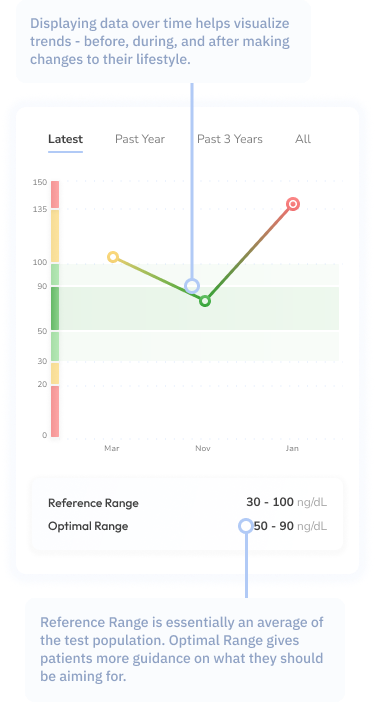
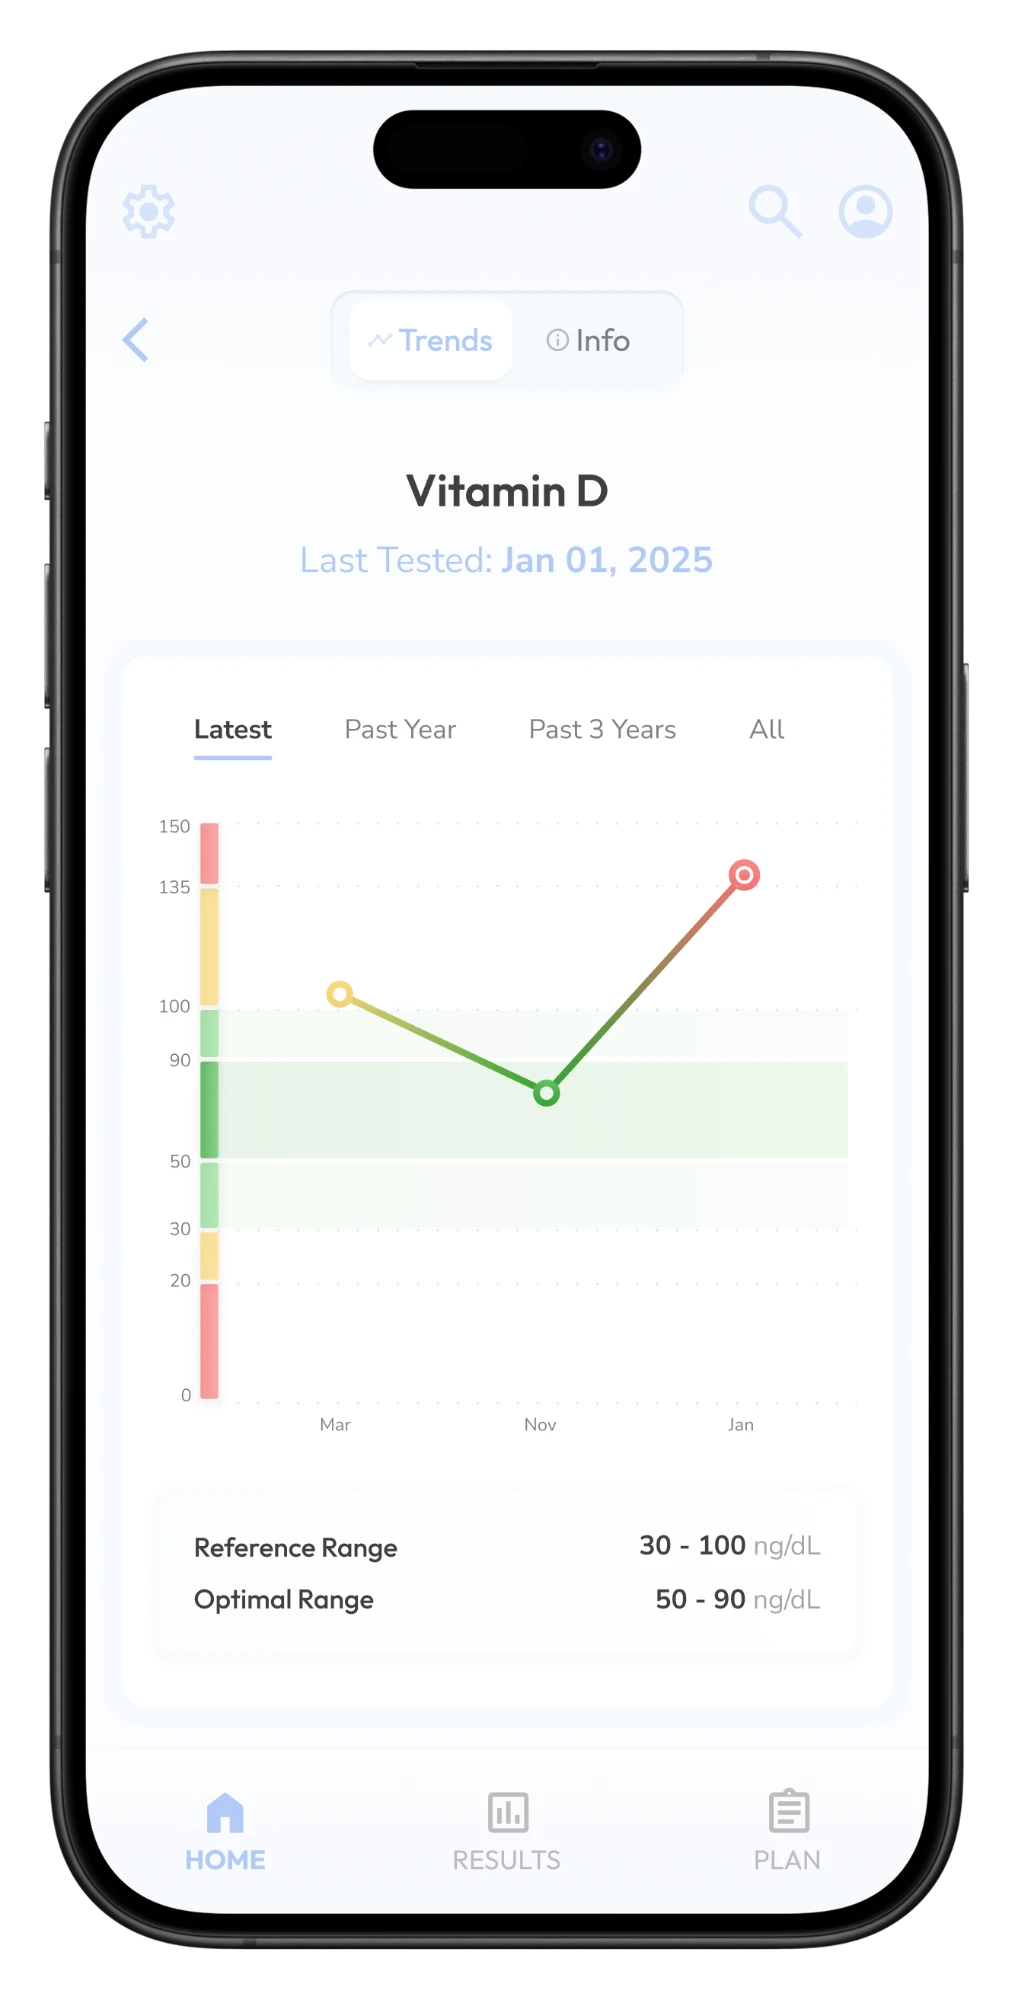
Vitamin D trend over three draws, banded by category
Timeframe
2025 – 2026
Company
CREXlabs
Scope
Product Design, Product Definition, User Research
Deliverables
User Research, Wireframes, Hi-Fi Mockups, Prototypes, Design System

The short version

Normal isn't the same as optimal.

A preventative medicine practice was ordering comprehensive blood panels for 500+ patients, then reporting them against ranges built to catch disease. I led the research, product definition and design of a patient app that sorts every result into four categories instead of two, and turns the gap between normal and optimal into a plan with the clinician's name on it.

500+Patients the practice wanted to help understand and act on their results
4, not 2Result categories: abnormal, borderline, normal and optimal
15 + ~400Deep-dive interviews and survey responses behind the model

The client

Medicine 3.0: optimize health before problems develop.

I partnered with a preventative medicine clinic that wanted a better way to help 500+ patients understand and act on their blood test results.

Read more

Private practice and concierge medicine have been growing steadily as patients look for more personalized, preventative care. Rather than treating illness after it appears, this shift — sometimes called Medicine 3.0 — is focused on optimizing health before problems develop.

The practice was already ordering far more comprehensive panels than a standard annual physical — the kind of testing that produces dozens of markers per draw rather than a handful. Interpreting these results, patient by patient, was time-consuming and was ultimately reduced to focusing on critical issues, rather than the healthspan and performance optimization problem that the clinic set out to solve.

More data made the underlying gap worse, not better: every additional biomarker was one more number reported against a range that wasn't built for the question being asked.


500+Patients in the practice
DozensMarkers per draw, not a handful
1×A year, the only time anyone looked at them together

My role

Research, product definition and design, end to end.

I worked with the medical director and his clinical team to define requirements and scope, ran the research, and drove the design from first wireframes to a prototype and a design system.

  1. User research

    Interviews and surveys with patients and the clinician across the whole lab-results experience, plus an afternoon going through the process myself to see where it actually broke.

  2. Product definition

    The four-category result model the product rests on, the rules for what the system asserts and what it defers to the clinician, and the MVP scope.

  3. Design & design system

    The end-to-end interface, from a single result through trends and plans, built on a reusable component system so the product stayed consistent as features were added.

What we heard

Five voices

Patients and the doctor describe the same failure from opposite ends.

The patients want something the doctor also wants to give them, and neither the appointment nor the existing software has room for it.

"I track everything from my sleep to my workouts, but I'm frustrated that my lab results just tell me I'm 'normal' when I want to know how to be optimal."
Tech professional, 28
"My hormones are all over the place, and I spend more time researching HRT and tracking my symptoms than my doctor spends listening to me during our 15-minute appointments."
Mid-life woman, 48
"We're busy parents who want to make sure we're healthy for our 3-year-old, but we barely have time to understand our own lab results."
Busy parents, mid-30s
"My mom had diabetes and my dad had heart disease, and I'm constantly worried about what might be developing silently that my annual checkup isn't catching."
Older adult, 61
"I want to spend consultation time optimizing my patients' health plans, but instead I'm explaining what their cholesterol numbers mean for the hundredth time this week."
Preventative medicine doctor

Personas & journeys

Four patients and one doctor, and a low point after the results arrive.

The five voices became five archetypes used to prioritize features. Journey mapping then located the low point precisely: not the draw, and not the diagnosis, but the stretch after results arrive.

Read more

The doctor persona was important because a feature that helped patients but cost the clinician time in an appointment that was already too short wasn't going to work.

Mapping emotional states across each touchpoint found the low point: a patient has numbers, no interpretation, and a year until anyone looks at them again. That got the team aligned on where the product's value actually had to sit.

User journeyThe low point sits after the results arrive: numbers, no interpretation, and a year until the next look.

What it added up to

Patients weren't short on data. They just didn't know what to do next.

What they needed was a prescription: a short, ranked list of things to actually do, with the reason attached and a clinician's name behind it. That reframing turned this from a data visualization project into a product.

  1. "Normal" doesn't mean optimal

    Healthcare is built to detect disease, leaving patients with "you're not sick" instead of "here's how to thrive", which is the whole reason they were paying for concierge medicine.

  2. Everyone is short on time, including the doctor

    Busy professionals, parents and doctors all need tools that deliver value within real-world time, rather than adding to already overwhelming schedules.

  3. Information overload without action

    Lab results, wearables and symptom tracking, and no way to connect the dots. Everyone needed complex health information translated into clear, personal next steps.

Lab panels, prior results, wearables, self-research and supplements all pour in at the patient. Interpretation and ranking, the clinic's read, turns them into a short ranked plan signed by the clinician: raise vitamin D, zone 2 cardio three times a week, recheck lipids in 90 days. Everything coming in Lab panels Prior results Wearables Self-research Supplements Interpretation & rankingThe clinic's read Your planSigned by your clinician 1 Raise vitamin DSupplement 2 Zone 2 cardio, 3×/wkMoves ApoB, glucose 3 Recheck lipids, 90 daysFollow-up lab Lab panels, prior results, wearables, self-research and supplements all pour in at the patient. Interpretation and ranking, the clinic's read, turns them into a short ranked plan signed by the clinician: raise vitamin D, zone 2 cardio three times a week, recheck lipids in 90 days. Everything coming in Lab panels Prior results Wearables Self-research Supplements Interpretation& rankingThe clinic's read Your planSigned by your clinician 1 Raise vitamin DSupplement 2 Zone 2 cardio, 3×/wkMoves ApoB, glucose 3 Recheck lipids, 90 daysFollow-up lab

Product definition

Building the right thing

Understand the result, act on a plan, see the trend.

The research resolved into seven requirements across three jobs a patient is trying to do, from the moment results arrive to the year between draws.

Read all seven

Results focused on optimization

Display biomarkers with four distinct ranges (abnormal, borderline, normal, optimal) instead of a binary normal/abnormal, with personalized explanations of what each result means for the patient's demographics, health goals and risk factors.

Integrate educational content

Explanations that scale in complexity by user type, from basic explanations for busy parents to detailed correlations for performance optimizers.

Actionable recommendations

Specific, prioritized recommendations (lifestyle, supplement, medication, exercise) based on individual biomarker gaps, with clear rationale for why each will move specific lab values and overall health goals.

Doctor's notes

On top of the generated recommendations, the doctor and clinical team can add and edit their point of view for that patient.

Data in the right context

A single result is nearly meaningless on its own; the same value can be good or bad news depending on where the patient came from. Every biomarker carries its history, banded by the same four categories, so a patient who has moved from borderline to normal can see that they're winning — most of what keeps someone doing the work between appointments.

Predictive health analytics

Trend analysis that shows projected trajectories as well as history, enabling early intervention before biomarkers move into concerning ranges.

Visualization on multiple time horizons

Flexible views — three months for hormonal cycles, six for lifestyle interventions — so each persona sees change in the context that fits their goals.

Receive & understand

Results focused on optimization

  • 01Four ranges instead of normal/abnormal
  • 02Education that scales with the patient
Act on a plan

Recommendations with a reason

  • 03Ranked, specific recommendations
  • 04Doctor's notes on top
See trends, not snapshots

Every result in context

  • 05History banded by category
  • 06Projected trajectories
  • 07Multiple time horizons

The new flow

The appointment answers questions instead of explaining numbers.

Results and the doctor's plan reach the patient's phone before the visit, so by the time they sit down they've already read them.

The new flow: the blood draw, then results delivered to the patient's phone along with the doctor's feedback and plan, all before the visit, so the visit answers questions. After it, a plan to act on every day until the next draw. On the patient's phone, before the visit Blood drawDrawn and sentfor testing Results are inDelivered straightto the app Doctor's planFeedback and a planfrom the doctor The visitAnswers questions;results already read Then a plan to act onevery day until the next draw The new flow: the blood draw, then results delivered to the patient's phone along with the doctor's feedback and plan, all before the visit, so the visit answers questions. After it, a plan to act on every day until the next draw. On the phone, before the visit Blood drawDrawn and sentfor testing Results are inDelivered straightto the app Doctor's planFeedback and a planfrom the doctor The visitAnswers questions;results already read Then a plan to act onevery day untilthe next draw

Anatomy of a result

The test result is the atomic unit.

Every report, trend and plan in the product is an aggregation of this one component, so it was designed first and argued about longest: what a single number has to say for a patient to know where they stand, and which way they're heading.

Read more

Four categories, not two

Abnormal, borderline, normal, optimal. Two categories answer a yes/no question about disease. Four answer a directional one: where am I, which way am I moving, and how far is the target. That's the question a preventative practice is actually asking, and the software had never been built to answer it.

Where the ranges come from

Abnormal is easy: it's the lab's own reference range, and the product doesn't second-guess it. Everything inside that range is where the product makes a claim the lab isn't. Those boundaries had to be defined per biomarker — some markers are two-sided, some one-sided, and several vary by sex, age and a patient's goals — which made this a clinical design problem long before it was a UI.

Clinician stays in the loop

Drawing a narrower band than the lab does is a real claim, and the product had to be honest about whose claim it was. The categorization is presented as the practice's position — not an independent diagnosis and not a replacement for the clinician's read. That's why the doctor keeps edit rights everywhere downstream.

Annotated result: the value shown alongside its colour-coded category, and a scale showing whether an abnormal result is too high or too low Annotated result detail with reference and optimal ranges
  1. Four categories, not two

    A directional answer: where am I, which way am I moving, how far is the target.

  2. Ranges defined per biomarker

    Two-sided, one-sided, and varying by sex, age and goals: a clinical design problem before a UI.

  3. The clinician stays in the loop

    The practice's position, presented as such, with the doctor able to edit everything downstream.

Scope discipline

Ship what hurt every persona. Defer what only helped some.

The research produced more good ideas than a first release could carry. The cut needed a rule rather than a vote, and the personas supplied one.

Read more

That rule is unglamorous and it settles arguments fast. Digestible reports, the four-category system, trends and improvement plans all cleared it: every archetype, patient and doctor alike, was blocked by their absence. AI coaching, interface personalization and a branded Health Score didn't. They were good ideas that served some personas much more than others, which makes them second-release ideas, not bad ones.

The Health Score is the interesting deferral. It's the most marketable feature in the set and the most dangerous to ship early: a single composite number is exactly the kind of reductive summary the product exists to argue against, and rolling it out before the four-category model had earned patients' trust would have undercut the thing that made the product different.

Shipped in the MVP

Every archetype was blocked by their absence

  • Digestible lab reports
  • Four-category results
  • Trend visualization
  • Improvement plans
Deferred

Good ideas that served some personas far more than others

  • AI coaching
  • Interface personalization
  • A branded Health Score

The Health Score was the most marketable idea and the most dangerous to ship early: a single composite number is exactly the reductive summary the product exists to argue against.

Design & validation

From wireframes to validation

The same people who described the problem tested the fix.

The original interview participants came back to test the prototypes, so they could be asked directly whether this solved the specific thing they had described months earlier.

Read more

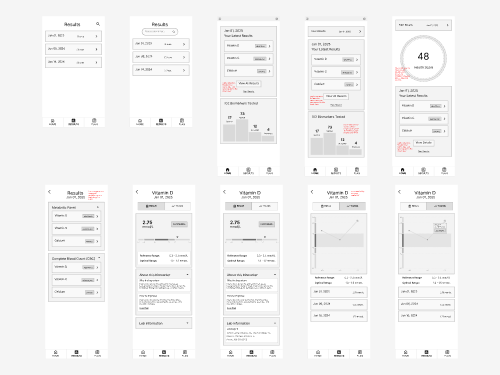
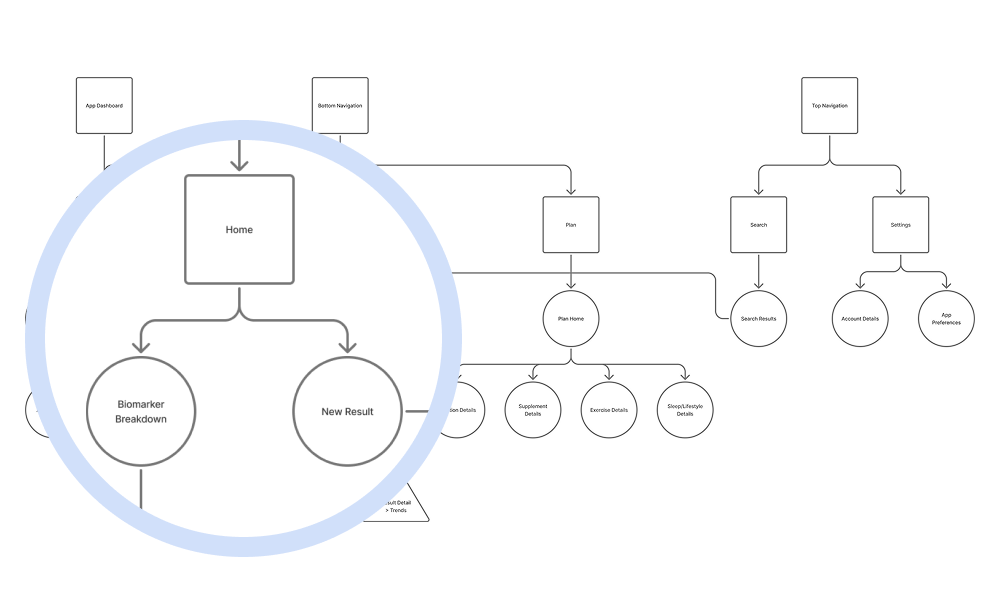
Wireframes and an IA diagram came first, and the IA earned its keep more than the wireframes did: agreeing on how results, reports, biomarkers and plans related to one another settled naming and hierarchy questions that would have been expensive to discover later in visual design.

Interactive prototypes covered the core workflows before any of it was committed to final visual design. A fresh testing pool would have told us whether the interface was usable. This pool could tell us whether it was the right product.

Final designs

Next project

Patient Data Portal

Turning raw claims data into a five-minute pre-visit lookup.